Election of 1860 – A Second Look
Posted By Norman Gasbarro on January 19, 2011
The election of 1860 was held throughout the United States on 6 November 1860. The result was that Abraham Lincoln won a majority of the electoral votes and thus was elected President of the United States. His election supposedly was the trigger that brought about the secession crisis. South Carolina voted to secede from the Union on 20 December 1860.
In a previous post some data were examined to try to determine how the people of the Lykens Valley area voted. Generalizations about the election were examined and questions were asked about voting patterns within the state of Pennsylvania. Was it possible to break down the vote by counties? by divisions within counties? by by ethnic groups? Four limiting factors were noted: (1) In 1860, there was no universal suffrage. (2) Convenience of the voting place to the home or workplace of the voter may have been a factor in the number of eligible persons who actually voted. (3) Voting was done not by secret ballot as is done today, but by eligible persons calling out their votes in open meetings – thus open to influence. (4) The Lykens Valley area that is referred to in this Civil War Project is not a “political division” because it consists of parts of three counties – Dauphin, Schuylkill, and Northumberland.
The first step in this “second look” at the Election of 1860, is to see what data is generally available on how people voted within the state of Pennsylvania and to see how that information is presented.
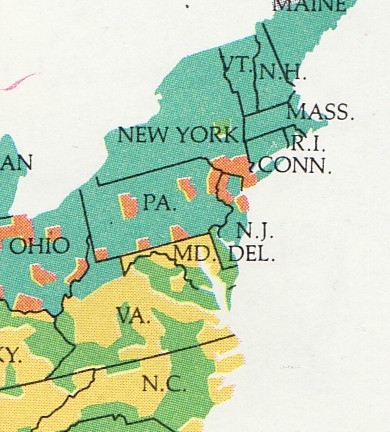
One of the first textbook maps for the Election of 1860 which shows how the popular vote was distributed by counties is found in A History of the United States (1983), authored by Daniel Boorstin and Brooks Kelley. Four colors were used to represent the votes for each of the candidates. A blue-green was used for Lincoln. Six patches of orange (or yellow) can be seen in Pennsylvania, indicating that at least six counties voted for someone other than Lincoln. But exactly which counties these patches represented is not clear. It looks though that the area of the Lykens Valley triangle is blue-green – a fact that will have to be verified from another source.
The orange, with the yellow shading, could indicate a vote for Stephen Douglas on the “Fusion Ticket,” as that was one of the options for voters in Pennsylvania (see post on Election of 1860 and the Lykens Valley).
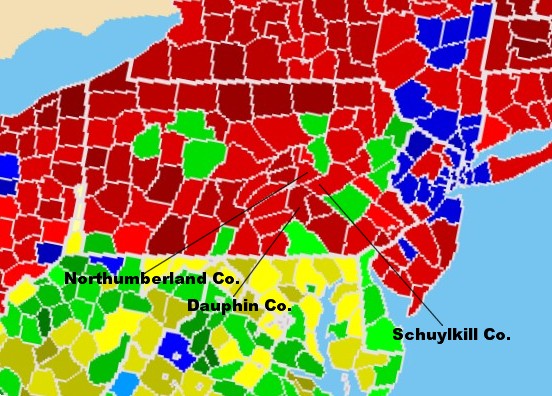
With the advent of on-line encyclopedias, information is available on elusive subjects as how people voted within counties in 1860. An election map is available through Wikipedia which shows specific county boundaries and who got the majority or plurality of votes in each county – but it only gives percentages in ranges rather than in actual numbers and the map doesn’t indicate how many people voted within the counties nor does it give the breakdown of votes within the county. By enlarging that portion of the area of the map for the Lykens Valley area, and labeling the counties, we can get a general idea that the counties of Dauphin, Schuylkill and Northumberland were strongly in favor of Abraham Lincoln.
It appears from this map that Dauphin County supported Lincoln very strongly while Schuylkill County and Northumberland County supported Lincoln strongly.
But the accuracy of the information on this map is in question for several reasons: (1) The color green indicates that some Pennsylvania counties gave John Breckinridge a plurality of votes. According to previously obtained information, it was Stephen Douglas who received a plurality of votes in Pennsylvania countries that Abraham Lincoln did not win. (2) The map from the Boorstin & Kelley history text only shows six areas where Lincoln did not receive a majority or plurality while the Wikipedia map shows eight areas. (3) The raw data (how many actual votes were received by each candidate in each county) are not presented, nor is there a source given for the information. Note: To be fair, the third point also applies to the Boorstin and Kelley text.
Because of the inaccuracies and limitations of the above data, we still cannot draw any conclusions about how the people of the Lykens Valley area actually voted. Actual raw data must be found for each Pennsylvania county and subdivisions within each county.
Research continues into this topic. Contributions and ideas are welcome.
The portions of the above maps are taken from the sources indicated and are presented for the purpose of criticism and literary review under the “Fair Use” doctrine of the United States Copyright Law.
 ;
;


Comments